Banco de pruebas Hardlimit
-
This post is being processed/translated. The original version will be shown:
Ya está disponible la versión 4 de la central del banco de pruebas. Se trata del mayor cambio desde que su estreno.
El tema ha sido mucho más extenso y complejo de lo planificado inicialmente, aunque el resultado ha merecido la pena totalmente. Todavía hay bastante flecos que cortar pero son ya cuestiones menores.
Tened en cuenta que aunque todo parezca similar a lo que había, internamente todo es nuevo. Eso quiere decir que, a diferencia de la antigua versión que era muy madura, esta está muy poco probada y puede haber fallos donde antes no los había.
Entre ChatGPT y yo hemos estado intentando generar páginas en tiempo real, pero no hemos sido capaces. Finalmente ha sido necesario crear una "pequeña" tabla con precálculos ya que la generación en tiempo real daba tiempos de espera de varios segundos. Es una gran mejora con respecto a lo que había, pero el resultado quedaba fuera de una escala de tiempo aceptable sin la caché. Sobre esto, estos cálculos son lo suficientemente rápidos como para hacerlos en el tiempo de validación, donde la velocidad de carga no es tan crítica, por lo que ya no se ejecuta ningún script periódicamente sino que cada vez que alguien sube un nuevo resultado, todo se actualiza en ese momento.
La idea inicial era sólo migrarlo todo a MariaDB, eliminar todo lo relacionado con el antiguo SGBD y separarlo todo en tres partes diferenciadas: los datos, el back-end y el front-end. Antes estaban un poco mezclados. Lo que viene siendo una mera refactorización, pero por el camino se han producido cambios funcionales, principalmente porque la reimplementación ha invitado a hacer mejoras y correcciones que estaban pendientes. Son estas:
-
En general:
· Se han corregido pequeños fallos latentes y se han añadido pequeñas mejoras que eran difíciles de conseguir con la anterior versión.
· Se ha modificado la metodología para mostrar varios idiomas.
· Ahora los nombres de los sockets muestran el nombre comercial (cuando existe) además del factor de forma y el número de pines.
· No se muestra la marca de en los modelos de procesador ya que mayoritariamente hay sólo 2 y todos sabemos quién fabrica cada serie/modelo.
· Se han hecho importantes mejoras en la seguridad.
· Se han eliminado una gran cantidad de inconsistencias en cosas como los nombres de socket, tipos de memoria o arquitecturas entre otros repartidas entre cpus, placas base y demás. -
En la ficha de procesadores (cpu.php):
· Porcentajes más claros en las comparativas por test.
· Se ha hecho una pequeña modificación en la metodología para determinar modelos similares (este algoritmo recibirá un cambio mayor próximamente).
· Ahora se muestra una descripción junto a unidades en ambos ejes de las gráficas.
· Las gráficas ahora muestran el desvío de rendimiento en por unidad en vez de en porcentaje.
· Se ha solucionado un fallo que impedía renderizar la página con procesadores monohilo. -
En las listas de últimas validaciones, ahora, en vez de mostrar el mensaje "Procesando resultado" en el último hardware validado:
· cuando el modelo de CPU no está disponible, se muestra información en crudo proveniente de la identificación del dispositivo.
· si se trata de una placa base, memoria u ordenador que no está disponible, no se muestra en la lista.
· en la lista de últimas memorias validadas, ahora se muestran todos los modelos de una sola validación (antes sólo se mostraba el primer slot con una memoria pinchada). -
Las fichas de placas base (motherboard.php) y ordenadores (computer.php) se han unificado en un solo lugar: mobopc.php. Las antiguas páginas redireccionan (HTTP 301) a la nueva.
-
Han cambiado los criterios para identificar una memoria RAM: Ahora sólo se usa el número de parte ya que, a veces, el nombre del fabricante llega ofuscado y eso produce entradas duplicadas.
-
En la página de arquitecturas (arch.php):
· Ya no se muestran los máximos y mínimos de las eficiencias ya que no tiene sentido mostrar extremos que podrían no ser representativos de la arquitectura (principalmente con los mínimos).
· Ahora se muestran puntuaciones medias en cada test individualmente.
· Alístate en la marina.
· Para el cálculo de las estadísticas, se descartan todos los resultados que no provengan del modo máximo soportado por la arquitectura (lo cual deja fuera ciertos modelos con cores de bajo coste que no soportan el modo máximo de la arquitectura y modelos cuyos envíos no se han hecho en el modo máximo por la razón que sea). -
En la lista de ordenadores por arquitectura, placas base por socket y RAM por tipo (x_list.php):
· Antes se mostraba la lista dividida por fabricante/chipset/formarto. Ahora se muestra la lista sin división. Esto recibirá cambios en el futuro aunque todavía no tengo clara la clasificación ni el formato. -
Sobre los intestinos de las validaciones, todo era código arcaico lo cual venía siendo código espagueti, sin tabular y sin comentar (me cago en mi yo del pasado). Aquí se ha rehecho casi todo desde cero porque la porquería que había no merecía la pena reusarla. Esto no ha sido divertido, para qué nos vamos a engañar:
· El motor interno de validación ahora tiene cuatro etapas:
1) Se recibe el resultado desde el programa a través de submit.php. Ahí se verifica la integridad de los datos.
2) Se envía al usuario a la página de login.php. Aquí se elige si el resultado es registrado o anónimo.
3) Se registra el resultado en register.php. Aquí se añade la información a la base de datos y ya se trata de una validación más.
4) Se muestra el resultado desde result.php. Este mareo me ha dado hambre, una de calamares, por favor.· Resulados (result.php):
* Se han añadido versiones de Windows faltantes y ahora se muestra también el nombre en clave de cada versión.
* Se ha añadido huso horario a la fecha de la validación.
* Se han eliminado los enlaces Markdown y vBulletin por limpieza de la página.
* Ahora el tamaño de los módulos se muestra en GB en vez de MB.
* La frecuencia de las memorias se muestra en MT/s en vez de MHz.
* Las gráficas de rendimiento con respecto al tiempo ahora muestran puntuaciones en miles. También se muestra una etiqueta con descripción y unidades en cada eje.
* Para hacer arroz con leche hace falta leche, arroz, canela, azúcar y cáscara de limón.
* Ahora en el ranking del resultado, salen enlaces a todos los procesadores (antes sólo salía enlace a la validación en cuestión).
* Ahora, en ese mismo ranking aparecen todos los resultados incluso con posiciones bajas (antes quedaba parte de la tabla en blanco).
* Ahora se muestra la diferencia de puntuación entre la media de ese modelo y el resultado enviado junto a un porcentaje.· Firmas (signature.php):
* Ahora las puntuaciones se muestran en miles.
* La cantidad de memoria se muestra en GB en vez de MB.
* El modelo de la placa base ahora proviene de la base de datos de modelos en vez del identificador del hardware, por lo que en bastantes casos, aparecerá más limpio y con un nombre comercial más familiar. -
La búsqueda ahora permite buscar, además de por puntuaciones como hasta ahora, por nombre de usuario, modo, color del lacasito, modelo y frecuencia medida.
-
Cosas que ya no están pero que volverán:
· Las sugerencias de búsqueda no funciona por un conflicto con el nuevo sistema de selección de idioma. Esto se está estudiando.
· Los rankings generales por modo y eficiencia (una página con bastante poco éxito y que hay que replantear).
· El ranking de portada de los envíos más rápidos.
· Gráficas en las comparativas de CPUs (esto seguramente no vuelva porque no tengo claro que sirva para algo).
Estos cambios puede que sepan a poco para un cambio de versión mayor. Los cambios han servido para tener una plataforma mucho más fácil de mantener y ampliar. El hecho de que sea todo más fácil de cara al desarrollo y la administración, hace que aumenten mucho las probabilidades de que aparezcan nuevas funciones y la base de datos de componentes se actualice en periodos mucho más cortos. Eso ya es un gran paso con respecto a lo que teníamos, donde me daba una pereza enorme hacer cualquier cosa. Para eso ha servido: para que no me de pereza hacer cosas de ahora en adelante.
Con esto, espero que las novedades del banco de pruebas vayan mucho más allá de simplemente haber añadido tal o cual hardware nuevo a la base de datos, dicho lo cual, se han añadido un buen número de piezas, aunque todavía quedan unas cuantas ya que he dejado esto abandonado más tiempo del normal y hay una buena cola.
Como he dicho antes, aunque aparentemente sea prácticamente igual a lo que había, internamente es casi todo nuevo, así que probablemente haya multitud de pequeños fallos (espero que no haya nada gordo). Así que si veis algo raro o echáis algo en falta, no dudéis en decirlo.
Toda la actualidad en la portada de Hardlimit
Mis cacharros -
-
@cobito Big effort boss
 let's see if I get a new PC and I can get my hands on it.
 -
Comparative tables have been created in the motherboard lists by socket, computers by architecture and RAM by format. For these tables, the formats of the new front-end have begun to be used.In addition, the new header has been propagated.
Toda la actualidad en la portada de Hardlimit
Mis cacharros -
Since the last message, the following changes have been made:
- It is now possible to sort lists of motherboards, computers and RAM memories by column.
- A bug in the generation of lists of RAM memories in the header menu has been fixed.
- Aesthetic improvements in the mobile version of the universal header (affects test bench and museum).
- A bug that prevented sending validations has been fixed.
- A bug in the rendering of the web during validation time has been fixed.
- Multiple small bugs have been fixed.
Toda la actualidad en la portada de Hardlimit
Mis cacharros -
Work has continued on the data presentation. Until now, the same information was displayed on both the mobile and desktop versions. This severely limited the amount of data that could be shown in the tables and left too much wasted space on the desktop version.
There are now two different versions:
- A desktop version showing extended information.
- A mobile version with simplified tables.
The selection of one version or the other is automatic.
For now, the new layout has been applied to the latest validations list on the homepage. Previously, four separate tables were shown for CPUs, motherboards, computers, and memory. Now, a single table is displayed containing all the information for each validation (for now, except for memory) along with the measured frequency (which wasn't shown before) next to the nominal frequency. This applies to the desktop version. For the mobile version, to make everything fit, columns are omitted and only the essentials are kept.
With this new desktop/mobile layout, a list of processors with their main specifications also now appears on the CPUs by architecture page. Example: https://bm.hardlimit.com/arch.php?a=AMD-Zen-5
Over time, it will be expanded to other sections.
Additionally, a bug has been fixed that caused the universal header menus (affecting both the test bench and the museum) to appear too narrow on the mobile version, making it difficult to navigate through the menus.
Finally, an issue with the layout of the motherboard and computer lists on the mobile version has been resolved.
Toda la actualidad en la portada de Hardlimit
Mis cacharros -
@cobito when you click to sort the results by Multi mode, it always sorts by Single mode. I wanted to see which are the fastest CPUs I've validated when sorting by Multi mode.
-
@krampak It's already fixed: mono and multi were swapped.
Toda la actualidad en la portada de Hardlimit
Mis cacharros -
Changes have been made that provide significant improvements to the loading times of all pages. We have also corrected some text formatting that was incompatible with the new version of the language selector.
Additionally, a few days ago we began marking results from overclocked CPUs in the list of latest cover page submissions.
Toda la actualidad en la portada de Hardlimit
Mis cacharros -
Single-thread and multi-thread per-user rankings are now displayed on the homepage. The ranking shows the best result per user-CPU to prevent a single user from dominating multiple positions with the same configuration.
Toda la actualidad en la portada de Hardlimit
Mis cacharros -
The first beta of the new version is now available. Since the executable is unsigned, you'll need to disable Smart App Control to test it. Be careful with this, because if you disable it globally on recent versions of Windows 11, it cannot be re-enabled without reinstalling the OS. I'm not sure if it's possible to add an exception for a specific executable.
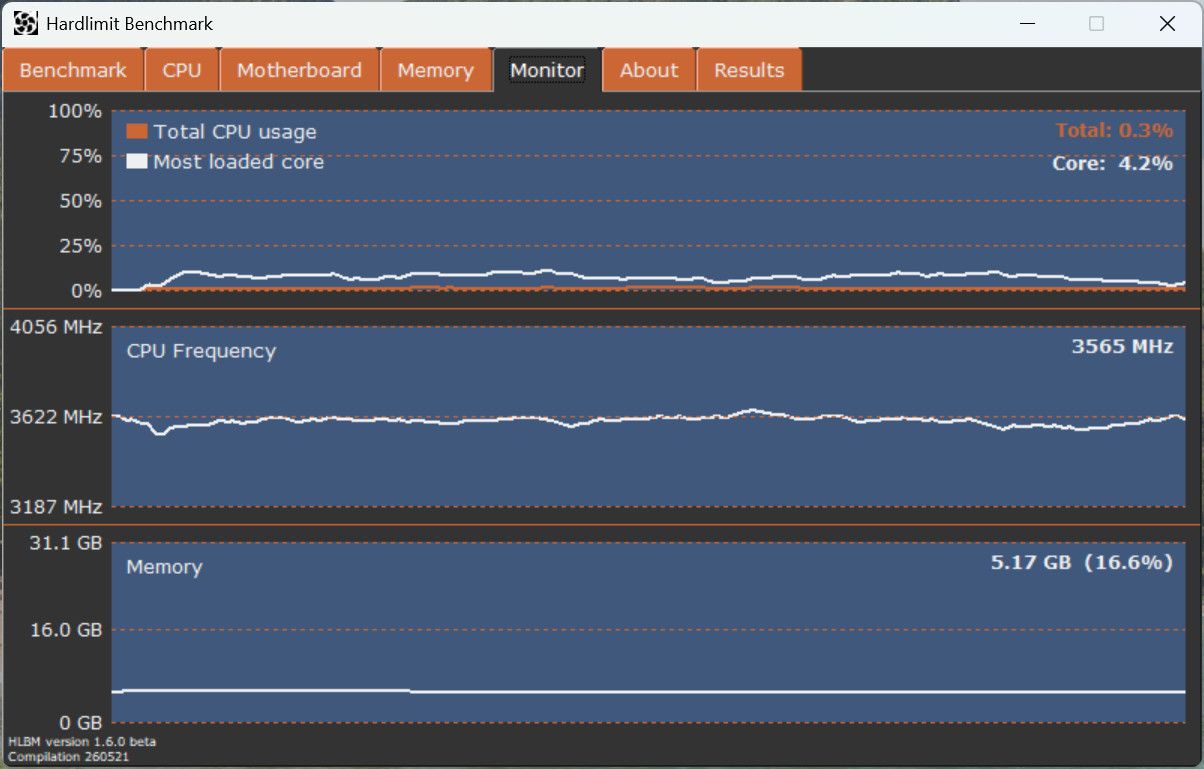
In essence (and without going into the details of internal changes), a new "Monitor" tab has been added, which displays a graphical representation of total CPU usage, the most loaded core (the one with the highest percentage usage), the current frequency, and memory usage.
The button to show more CPU information has been fixed. Now, clicking it opens the processor spec sheet in the browser.
An artificial limitation has also been found that prevents detecting more than 96 threads, which explains some results from monstrous CPUs that were submitted and where this limit was visible. This remains unresolved for now.The download is available here.
With this version, you can validate results as if it were the current stable version.
Toda la actualidad en la portada de Hardlimit
Mis cacharros -
@cobito I took a quick look at it (I tested it with Wine from Linux) and it looks more modern, and the monitor seems very useful to me... I ran the test to compare it with the one I did on W11 and... well... I already figured it would have lower performance...
-
@cobito Tested, everything seems fine at first. It did take a slight hit on performance, but I also have my entire development environment loaded and I haven't rebooted in days. If you need me to, I can test it again. I'm not sure if it did this before, but I like that it compares it to the registered average for your processor. It saved me from having to look up old results.

As for the resource monitor, I notice it updates very slowly while the test is running, but at idle the graph updates extremely quickly, as if the elapsed time axis weren't the same. Is this normal?
-
@cobito it wasn't the first time I took the test, but it was the first time I registered it with my nickname (at least I think so). The thing is, I noticed a slight discrepancy between what the test itself says and what appears on the page. Well, just to be clear, it doesn't really matter to me, I'm just mentioning it in case it helps or if that's just how it works:

As always, excellent work
")
Cheers!!
-
@krampak: Regarding the resource monitor, I notice it moves very slowly when the test is running, but while idle the graph runs at full speed, as if the elapsed time axis weren't the same. Is this normal?
The design intention for the graphs is for them to refresh quickly, much faster than in Task Manager. At the moment (this isn't the final number), the refresh rate is 24Hz.
It's normal for them to lag during the test because hlbm-core hogs all the CPU time on that thread. During the test, the graphs shouldn't be displayed since they consume a small amount of CPU, which alters the result (that might be why your score dropped). The end goal is to prevent tab switching during the test and instead display numerical consumption values on the "Benchmark" tab with a lower refresh rate.
@cobito it wasn't the first time I've taken the test, but it was the first time I've logged it under my username (at least I believe so). Anyway, I noticed a slight discrepancy between what the test itself reports and what shows up on the website. Well, just to be clear, I don't mind at all; I'm just pointing it out in case it helps or in case it's actually supposed to work this way:
Indeed, there is a discrepancy in methodologies that was accidentally introduced in v.4.x.x of the central server. Actually, it's a bug on the server side, not in the program. Thanks for the reminder, as I don't think I even had it noted down.
Thanks to everyone for the comments and for running the tests.
Toda la actualidad en la portada de Hardlimit
Mis cacharros -
Central
The "process" (manufacturing process) field has been added, which now shows both the commercial name and the gate width on the processor page (cpu.php).
Program
- @pos_yo now appears in the credits in the "About" tab as a beta tester.
- A stress test has been added (Stress Test tab). You can choose single-thread or multi-thread mode. There are two modes that cannot be configured by the user:
- "Normal" (AVX2 + FMA 3) for Haswell/Steamroller and newer.
- "Compatibility" (SSE4.1) for current low-cost processors and from the Penryn/Bulldozer generation onwards. For processors older than those, stress test support is not provided unless there is interest.
- During the stress test execution, only the Stress Test and Monitor tabs can be viewed.
- Software requirements are now 64-bit Windows 10 and 11. It is not compatible with 32-bit systems or Windows 7 and earlier.
- Now, during benchmark execution, you cannot switch tabs to avoid additional overhead during the tests.
- During benchmark execution, total CPU usage and the usage of the most loaded core are displayed in numerical values (at a 1Hz update rate).
- The brand and part number of each memory module are now displayed next to its slot number.
- A button has been added to view the details available in the central database for the memory installed in each slot.
- Clicking the logo in the "About" tab now opens the forum.
- There are no changes related to the test bench Core: you can continue validating as usual, and there should be no behavioral changes in this regard.
You can download this build from here.
Toda la actualidad en la portada de Hardlimit
Mis cacharros -
Central
The "process" (manufacturing process) field has been added, showing both the commercial name and the gate width on the processor sheet (cpu.php).
Program
- @pos_yo now appears in the credits on the "About" tab as a beta tester.
- A stress test has been added (Stress Test tab). You can choose single-thread or multi-thread mode. There are two modes that cannot be configured by the user:
- "Normal" (AVX2 + FMA 3) for Haswell/Steamroller and later.
- "Compatibility" (SSE4.1) for current low-cost processors and from the Penryn/Bulldozer generation onwards. For processors older than those, stress test support is not provided unless you have an interest in it.
- During the stress test execution, only the Stress Test and Monitor tabs can be viewed.
- Software requirements are now Windows 10 and 11 (64-bit). It is not compatible with 32-bit systems or Windows 7 and earlier.
- Now, during benchmark execution, you cannot switch tabs to avoid extra overhead during the tests.
- During benchmark execution, total CPU usage and the most loaded core's usage are displayed in numerical values (1Hz refresh rate).
- The brand and part number of each memory module are now displayed next to its slot number.
- A button has been added to view the details available in the central database for the memory installed in each slot.
- Clicking on the logo in the "About" tab now opens the forum.
- There are no changes related to the Core of the benchmarking suite: you can continue validating as usual, and there should be no behavioral changes in this regard.
You can download this build from here.
As a suggestion, I would say try to match the design across the different tabs. I would aim to always center the content (both vertically and horizontally), as right now everything is a bit mixed up, and now that you've increased the form size, it's more noticeable (I assume it was for the Monitor section).
By the way, does the end of the monitor's graph (left side) do weird things? It looks like a whip
-
@krampak Thanks for the notes. Noted.
I'll sort out the aesthetics once everything is more clearly defined. I enlarged the window for the Monitor, yes, but also to display more information in pre-existing tabs. For example, the memory tab now shows up to 8 memory slots that take up practically the entire area when they are present.
Yes, the graph does some weird things. It's due to the moving average. The statistics show too much variability if displayed at the refresh rate, and honestly, it doesn't produce a graph that's easy/pleasant to interpret. That's why it's smoothed using a moving average, which is what fails when the samples start dying out. Noted.
Toda la actualidad en la portada de Hardlimit
Mis cacharros
Hello! It looks like you're interested in this conversation, but you don't have an account yet.
Getting fed up of having to scroll through the same posts each visit? When you register for an account, you'll always come back to exactly where you were before, and choose to be notified of new replies (either via email, or push notification). You'll also be able to save bookmarks and upvote posts to show your appreciation to other community members.
With your input, this post could be even better 💗
Register Login